


Turning complex financial data into faster decision-making.
Helping users make faster, more confident financial decisions through centralized data and clear visual hierarchy. Designed with a strong background in dashboards and data-driven interfaces.
Sole designer responsible for end-to-end product design, from research and strategy through to high-fidelity prototyping and handoff.
01./// Project Overview
Context
With a strong background in designing dashboards and data-driven interfaces, I saw in this project an opportunity to consolidate my experience into a complete financial management product.
Throughout the design process, I analyzed common behaviors found in budgeting and banking apps, identifying friction points related to navigation, data overload, and lack of actionable insights.
My Role & Responsibilities
- Low and high fidelity prototypes
- Requirements gathering
- Reference studies
- Interaction design studies
- Feature studies
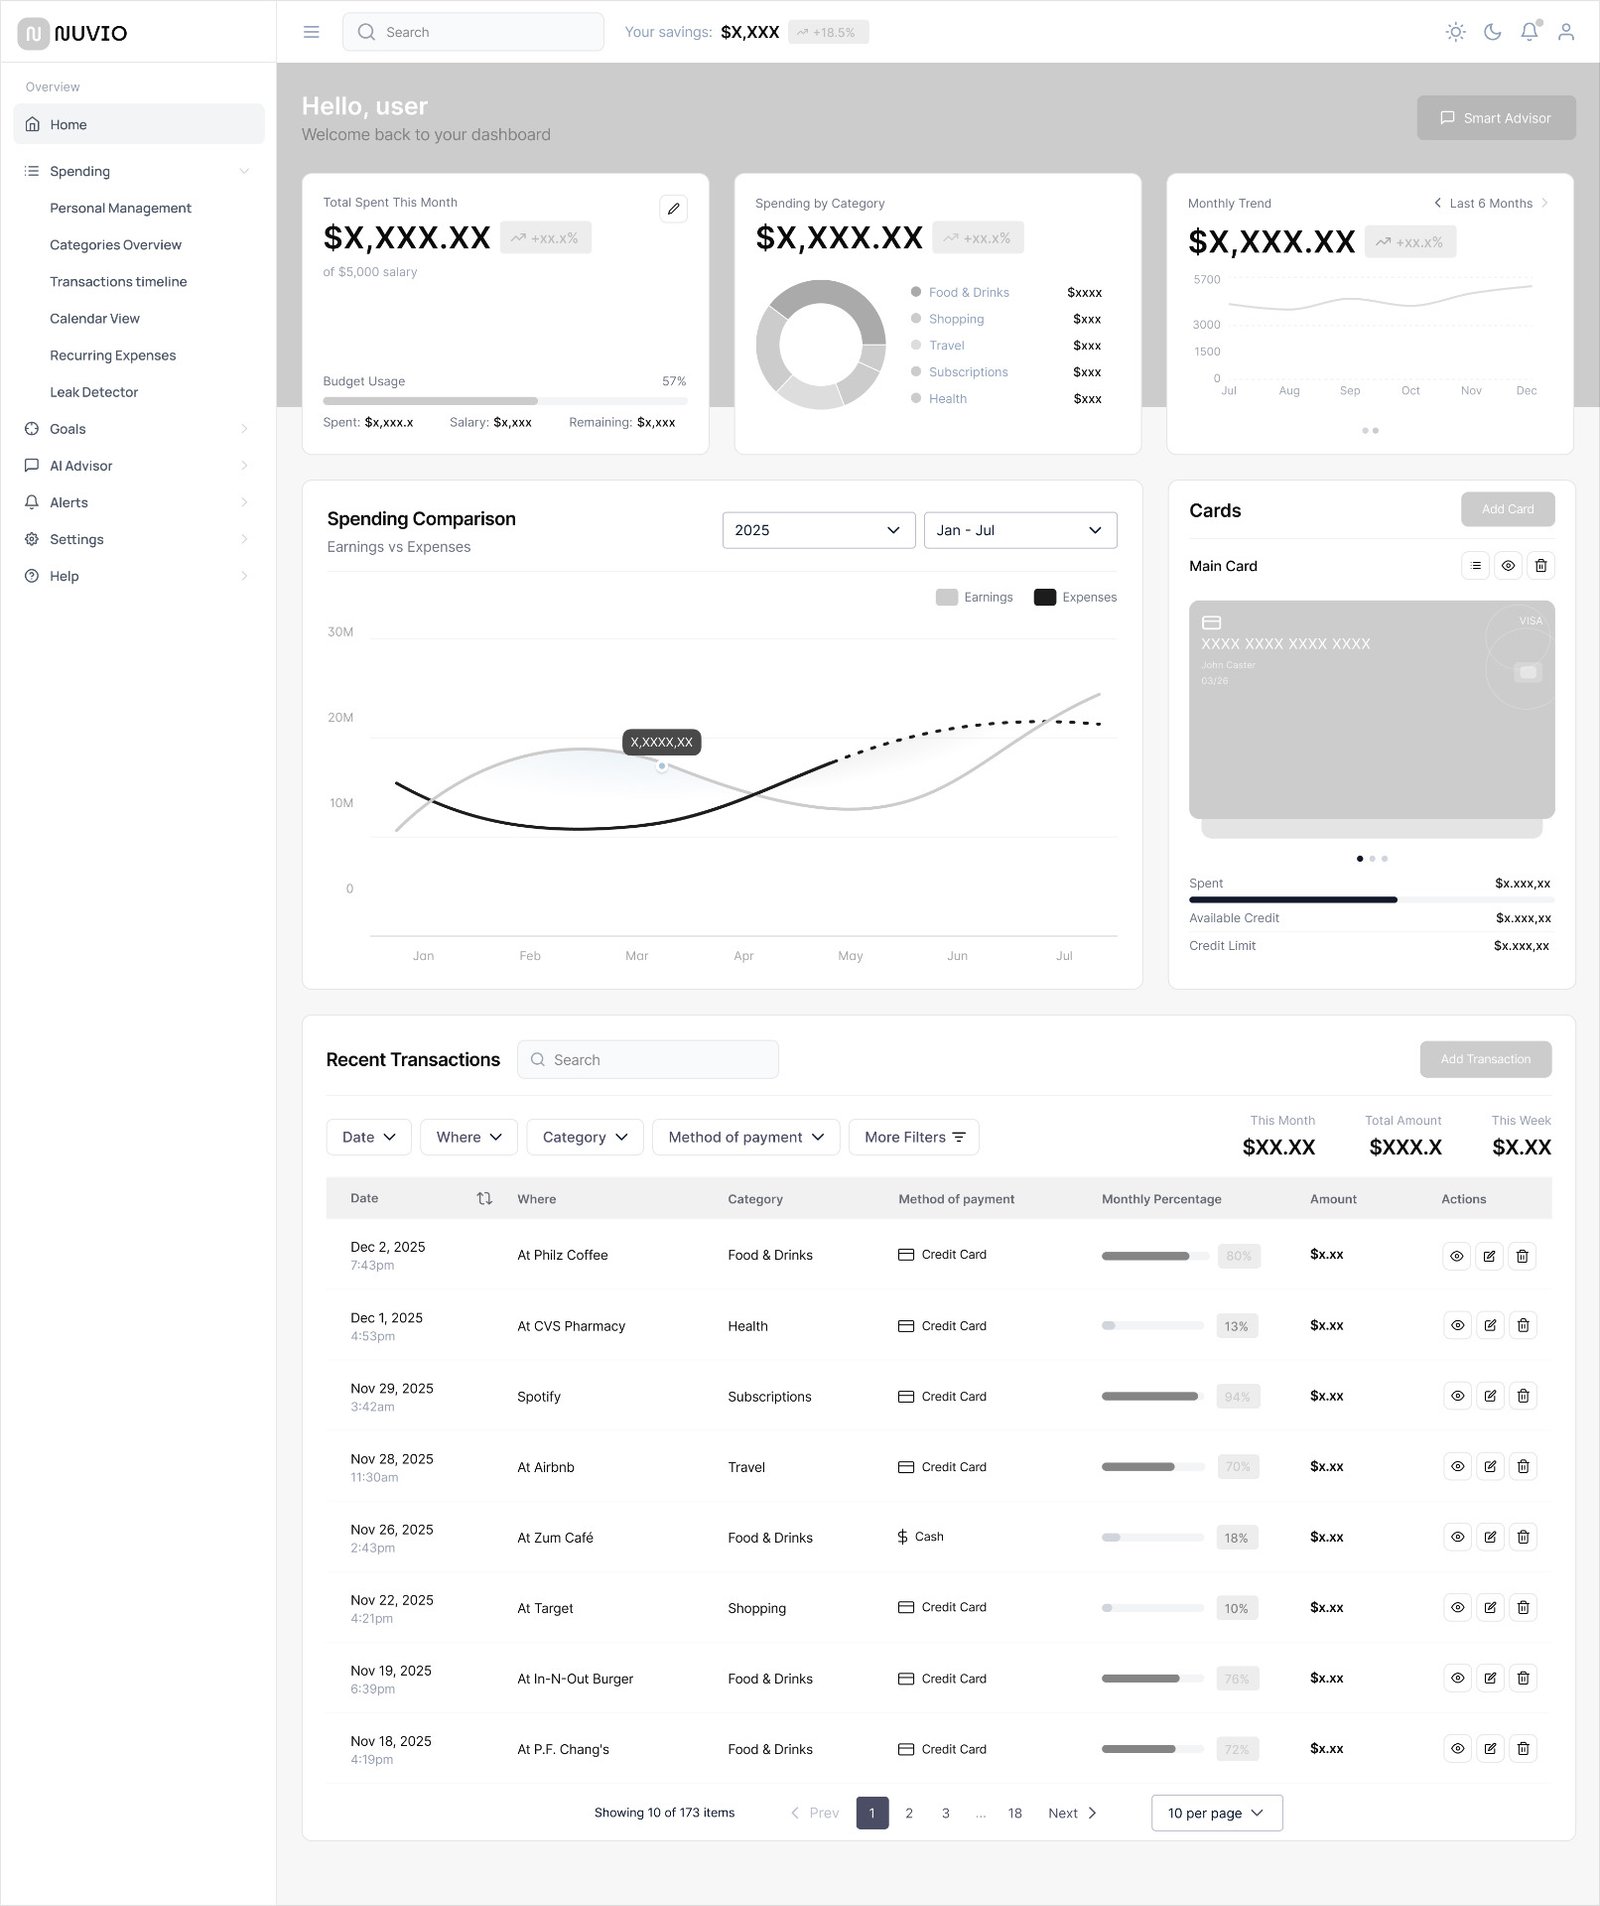 Low-fi wireframes
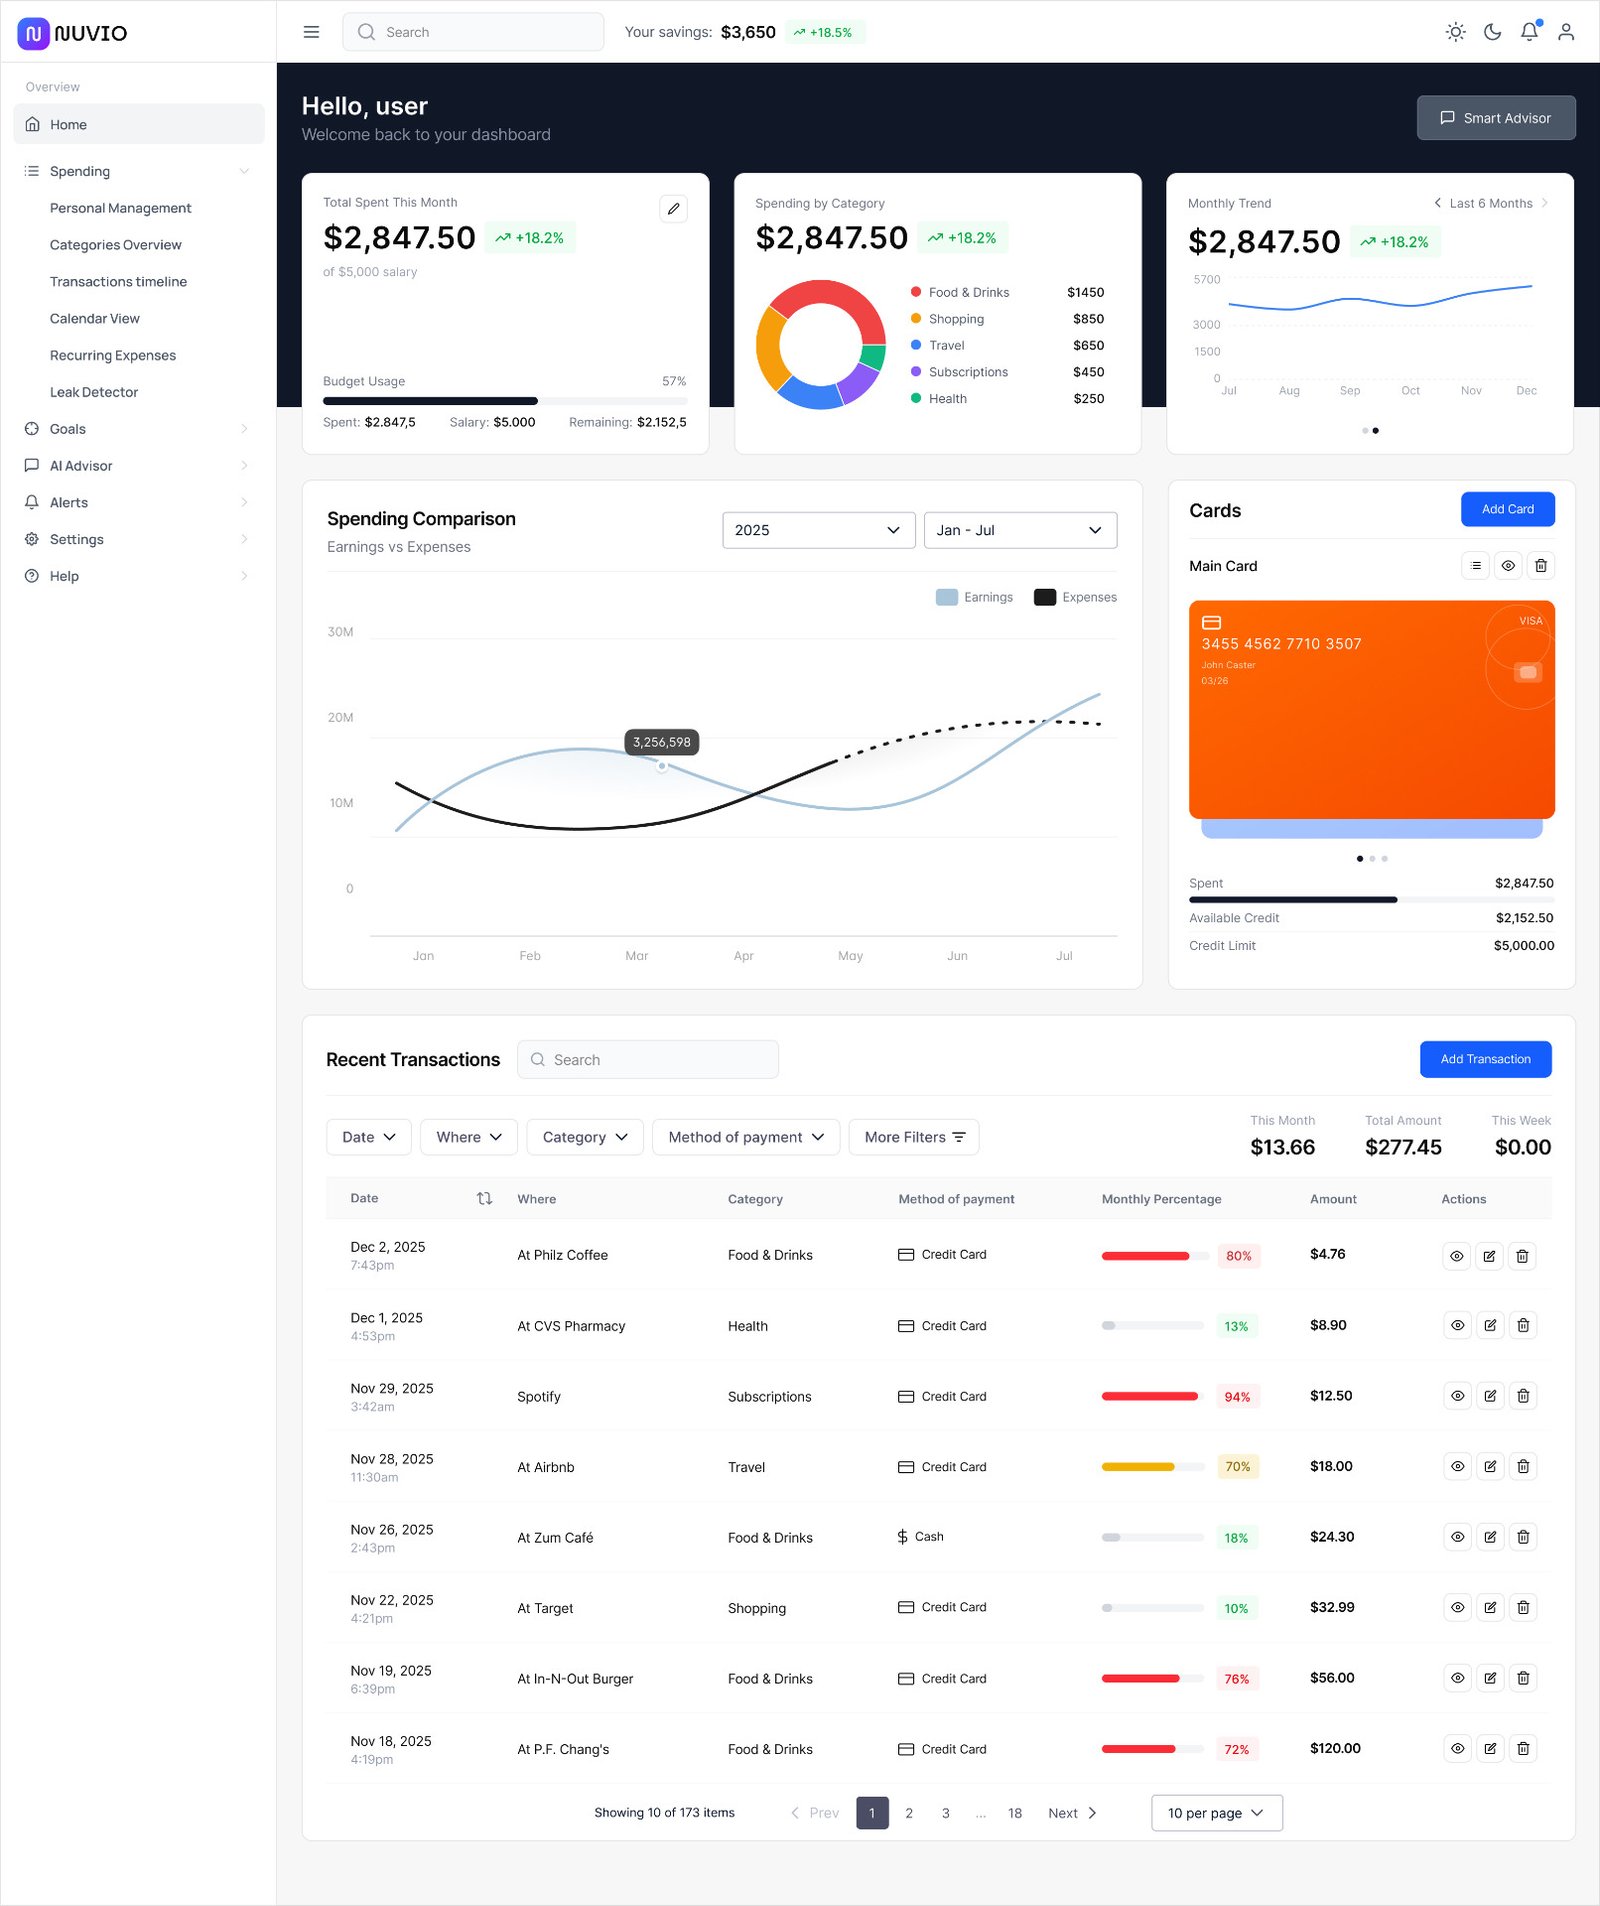 High-fidelity wireframes
02./// Success Metrics
How success is measured
Acquisition
Sign-ups by channel
Understand where users with the highest retention potential come from
In numbersMonth-over-month growth above 10%
Activation
Bank connection
Ensure the user experiences the core value of the product in the 1st session
In numbers80% of connections successful on the 1st attempt
Manual transaction entry
Identify bank integration failures before they turn into user loss
In numbersLess than 30% of transactions entered manually
D7 activation event
Measure how many users connected at least 1 bank or added 3+ transactions in the 1st week, indicator that the user actually understood and used the product, not just signed up
In numbers60% of new users activated by D7
Retention
D7 / D30 / D90 retention
Understand at which point in time the product loses the user
In numbersD30 above 40%, D90 above 25%
Weekly session frequency
Distinguish engaged users from users who simply haven't cancelled
In numbers3+ weekly sessions among active users
Usage depth
Identify whether the user is exploring the product or just checking their balance
In numbers50% accessing at least 2 sections beyond the Home screen
Alert open rate
Validate whether spending notifications are delivering real value
In numbersAbove 35% open rate
Satisfaction
Support volume by issue type
Map where the interface fails before it becomes a scalability problem
In numbersLess than 5% of active users opening a ticket per month
NPS at D30
Capture silent dissatisfaction before it turns into cancellation
In numbersNPS above 40
03./// Project Images
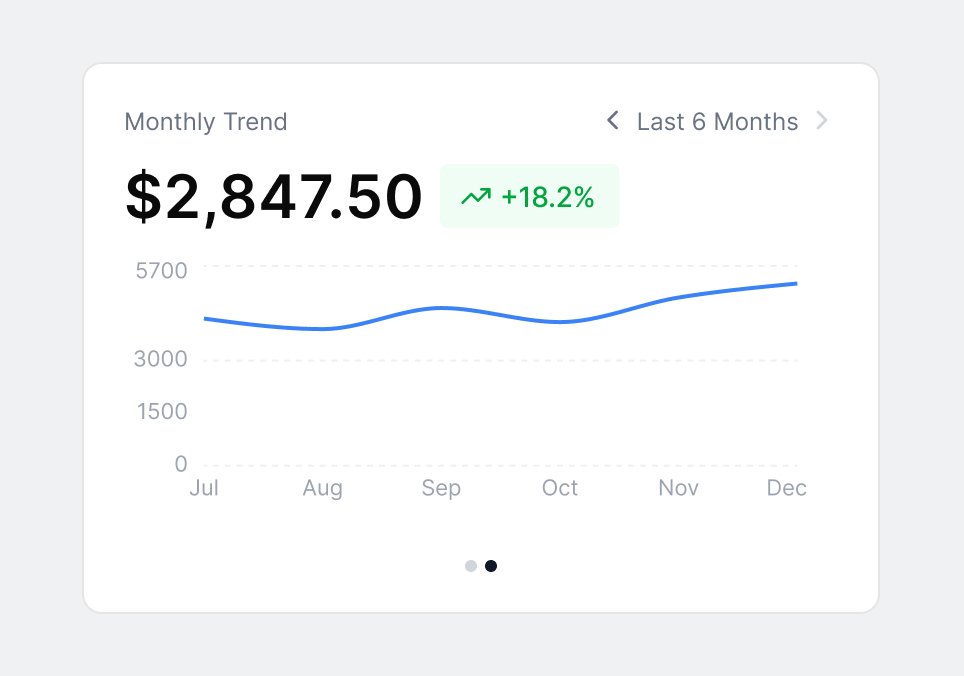
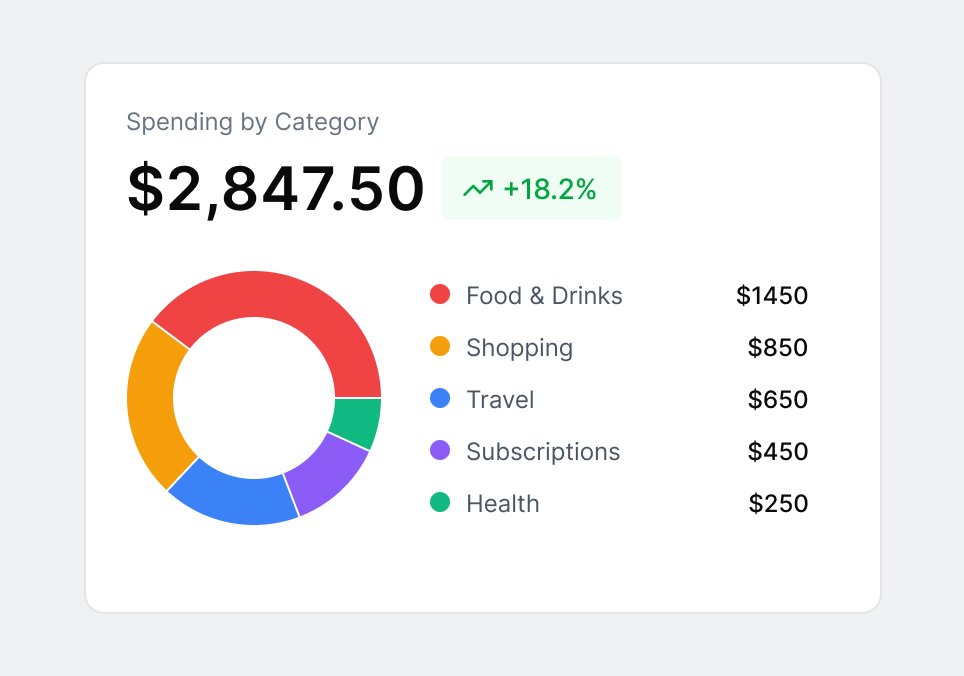 Spending analysis
 Dashboard overview
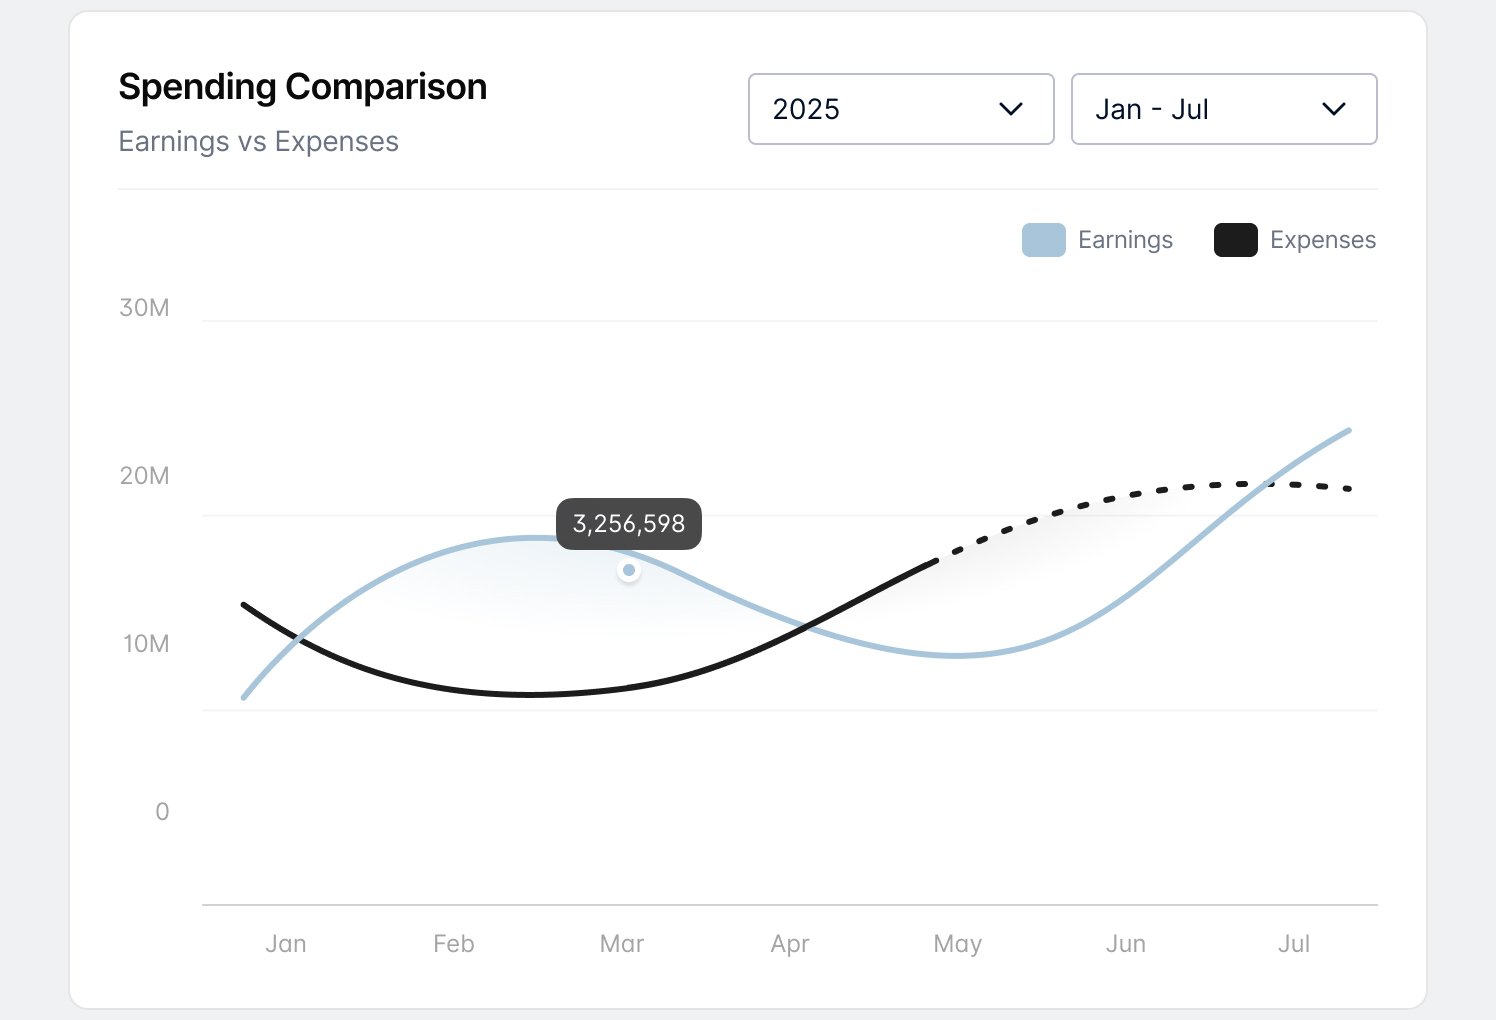
 Card management
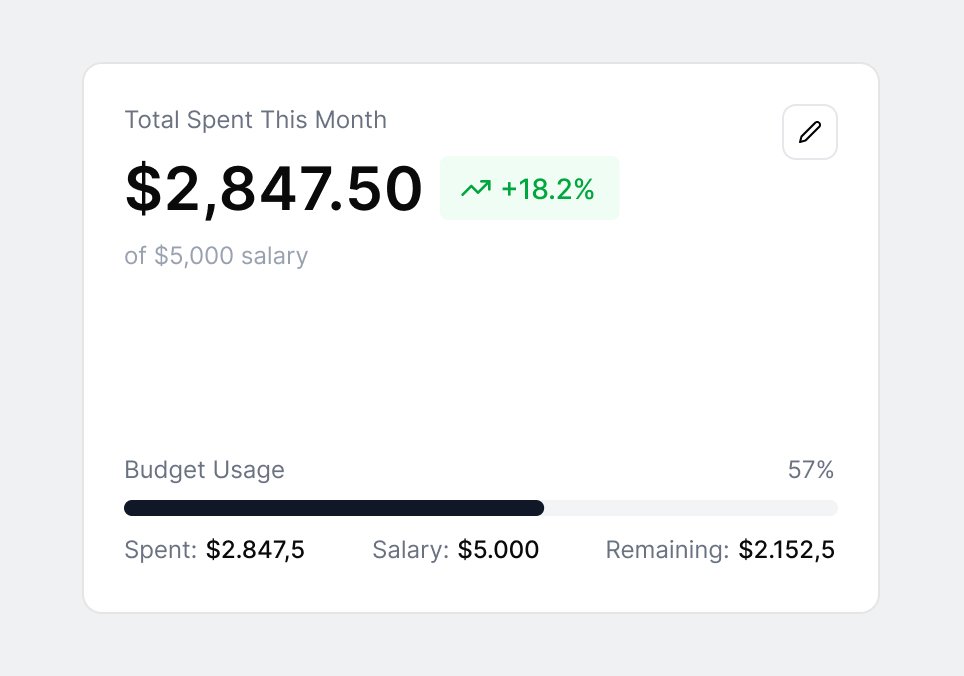
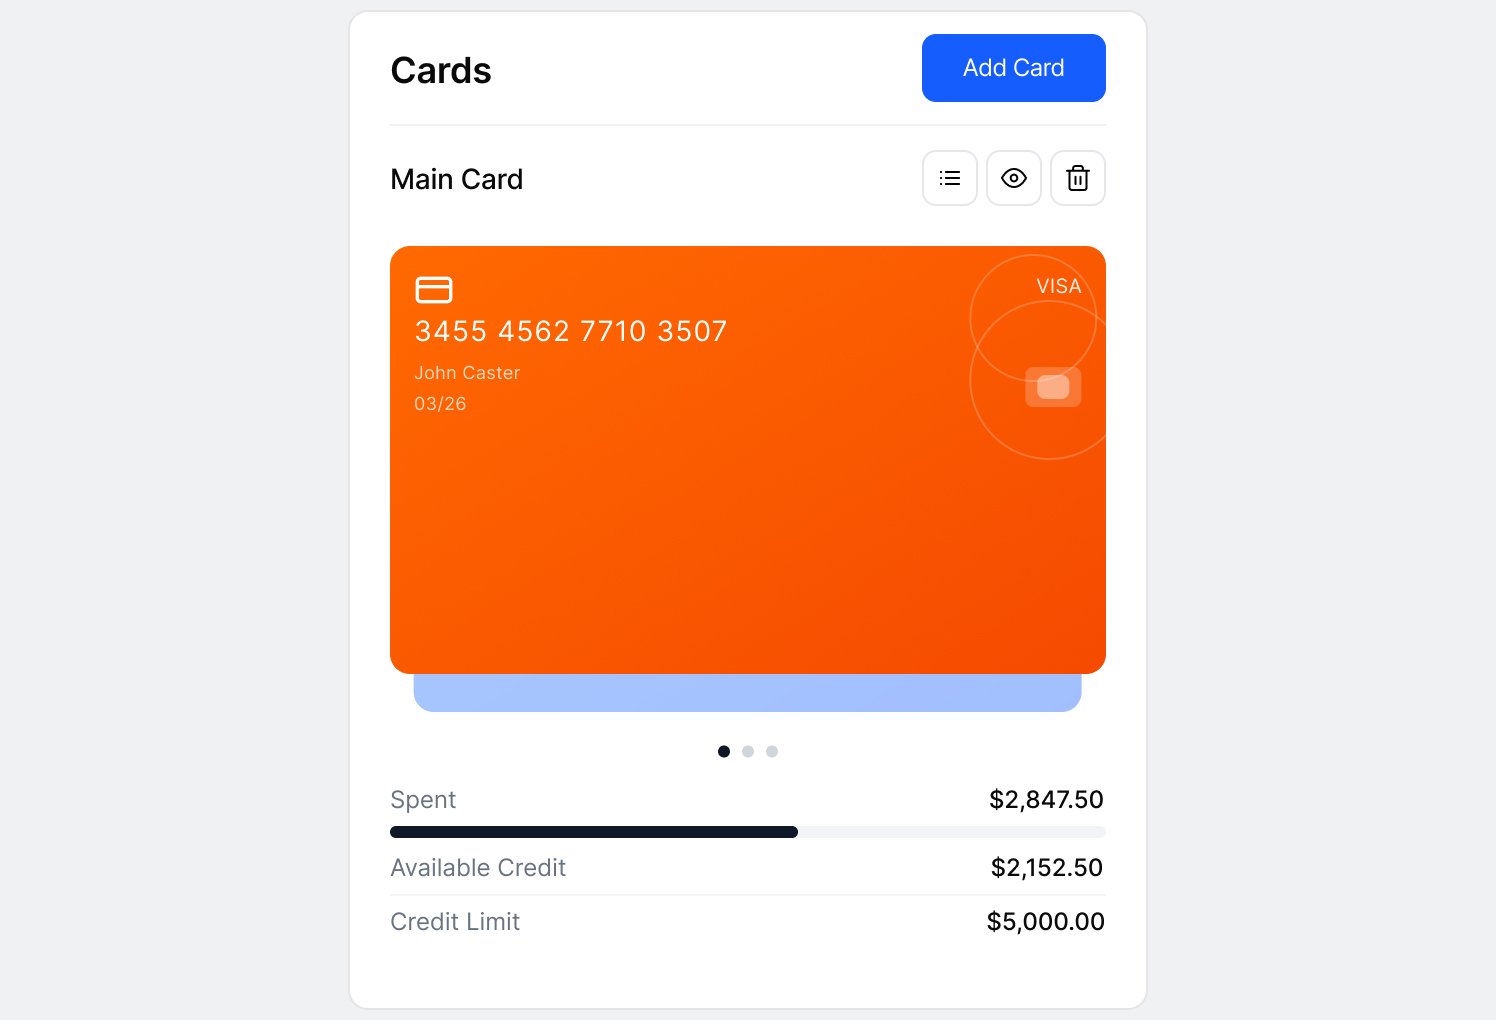
 Budget tracking
 Financial insights
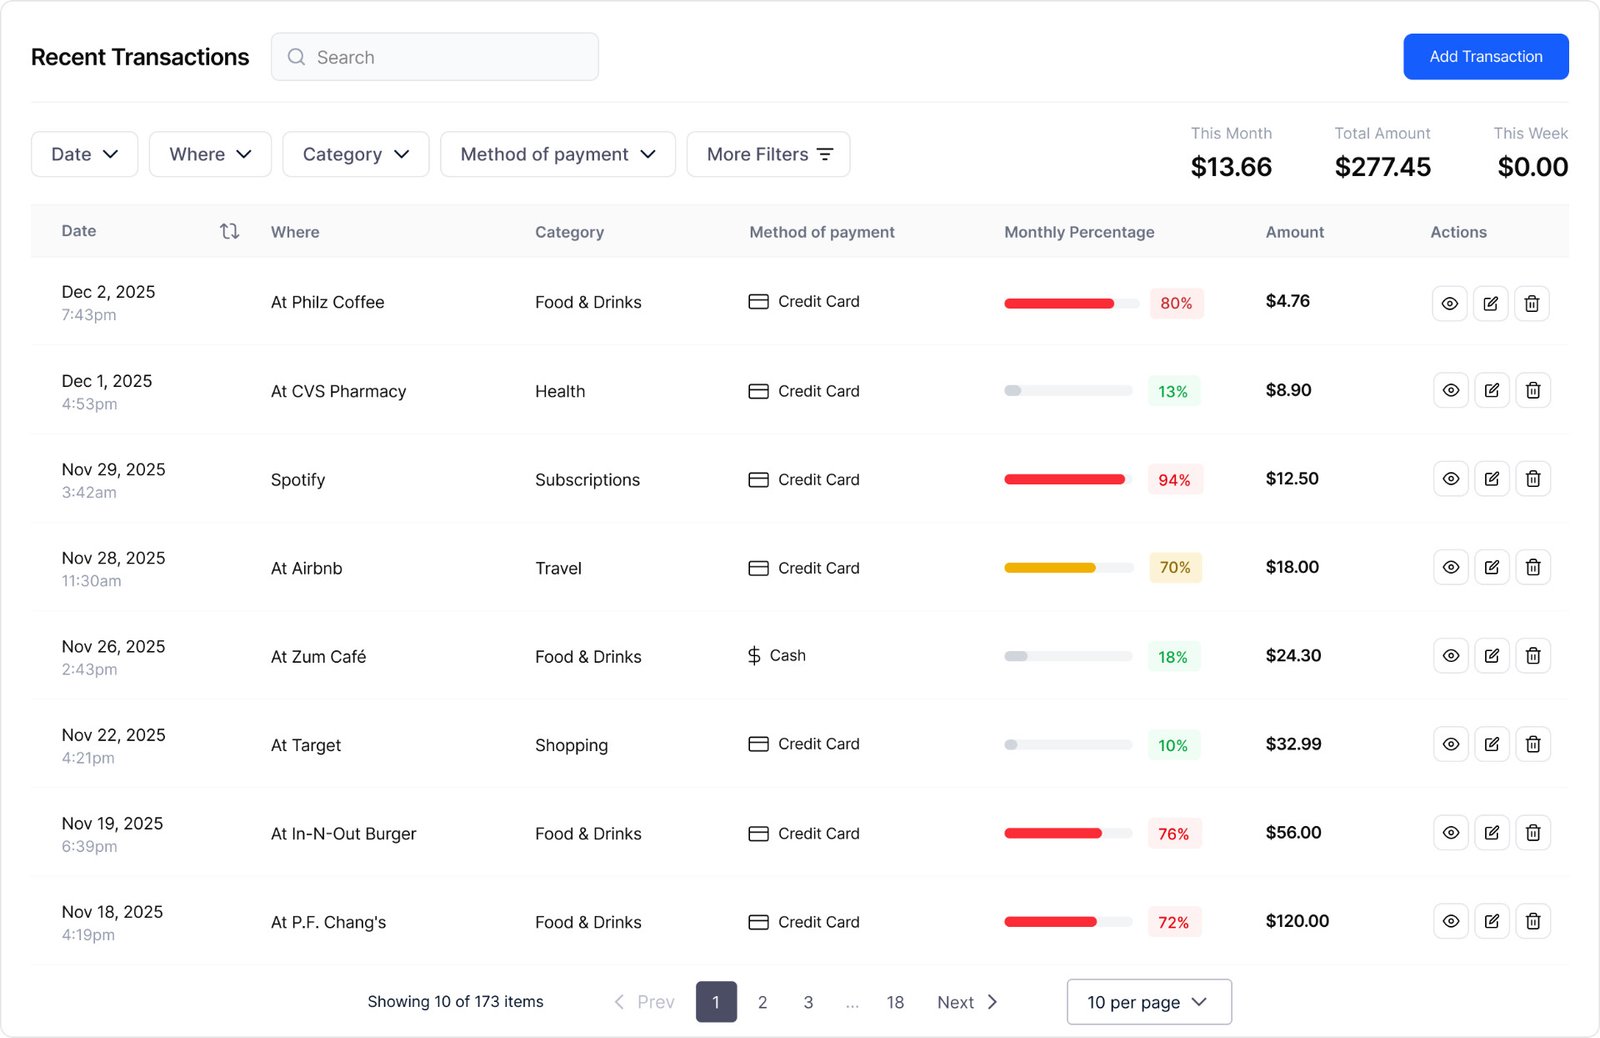 Transaction table